Nevada's 2nd congressional district
| Nevada's 2nd congressional district | |||
|---|---|---|---|
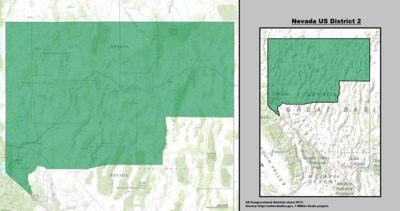 Nevada's 2nd congressional district – since January 3, 2013. | |||
| U.S. Representative |
| ||
| Population (2016 est.) | 713,779 | ||
| Median income | $61,225[1] | ||
| Ethnicity |
| ||
| Cook PVI | R+7[2] | ||
Nevada's 2nd congressional district is a congressional district that includes the northern third of the state. It includes most of Lyon County, all of Churchill, Douglas, Elko, Eureka, Humboldt, Lander, Pershing, Storey, and Washoe counties, as well as the state capital, Carson City. The largest city in the district is Reno, the state's third largest city. Although the district appears rural, its politics are dominated by Reno and Carson City. As of 2017, over 460,000 people reside in Washoe County alone, totaling about two-thirds of the district's population.
The district was initially created after the 1980 Census, when Nevada was split into districts for the first time. From then until 2013, it occupied all of the state outside of Clark County. From 1993 to 2013, it also included the far northern portion of Clark County. Until 2013, it was the third-largest congressional district by land area that did not cover an entire state. Even though it lost much of its southern portion to the new 4th District after the 2010 census, it is still the fifth-largest district in the nation that does not cover an entire state.
Population estimates indicate that the district will be expanded after the 2020 Census. As of 2015 the district is underpopulated by 15,000.[3] A possible second district based on the 2016 population estimates would cover all of the state outside Clark and Nye counties, but 11,141 residents.[4] Population projections indicates that after the 2020 census the district can encompass all of the state outside Clark and Nye.[5]
Historically, the 2nd has had a heavy Republican lean. It has been represented by only four people since its creation, all Republicans. Democrats have only made four serious bids for the seat. In presidential elections, the district has historically voted Republican; George W. Bush won the district by 20 points in 2000 and 16 points in 2004. However, in the 2008 election John McCain earned only 88 votes more (out of 335,720 votes) than Barack Obama in the district.
Former state Senator Mark Amodei has held the seat since 2011 after he won the special election to replace Dean Heller, who was appointed to the United States Senate following the resignation of John Ensign.
.mw-parser-output .toclimit-2 .toclevel-1 ul,.mw-parser-output .toclimit-3 .toclevel-2 ul,.mw-parser-output .toclimit-4 .toclevel-3 ul,.mw-parser-output .toclimit-5 .toclevel-4 ul,.mw-parser-output .toclimit-6 .toclevel-5 ul,.mw-parser-output .toclimit-7 .toclevel-6 ul{display:none}
Contents
1 2011 special election
2 Voting
3 List of representatives
4 Election results
4.1 1982
4.2 1984
4.3 1986
4.4 1988
4.5 1990
4.6 1992
4.7 1994
4.8 1996
4.9 1998
4.10 2000
4.11 2002
4.12 2004
4.13 2006
4.14 2008
4.15 2010
4.16 2011 (special)
4.17 2012
4.18 2014
4.19 2016
5 Historical district boundaries
6 See also
7 References
8 Notes
2011 special election
On April 21, 2011, U.S. Senator John Ensign (R-Nev.), plagued by scandal and facing an inquiry by the Senate Ethics Committee, announced his resignation effective May 3.[6] On April 27, Governor Brian Sandoval announced he would appoint Dean Heller, the 2nd district's third-term congressman, to fill out Ensign's term in the Senate. Heller had already planned to run for the seat after Ensign announced a month earlier that he would not run for a third term. To fill the vacancy created by Heller's resignation on May 9, Sandoval was required to call a special election to be held within six months of the occurrence of the vacancy.[7]
A special election was held on September 13, 2011. Former Republican state senator Mark Amodei defeated Democratic State Treasurer Kate Marshall.[8]
Voting
Election results from presidential races[9]
| Year | Office | Result |
|---|---|---|
| 1984 | President | Reagan 69 – 29% |
| 1988 | President | Bush 62 – 35% |
| 1992 | President | Bush 38 – 33% |
| 1996 | President | Dole 47 – 39% |
| 2000 | President | Bush 57 – 37% |
| 2004 | President | Bush 57 – 41% |
| 2008 | President | McCain 49 – 49% |
| 2012 | President | Romney 53 – 45% |
| 2016 | President | Trump 52 – 40% |
List of representatives
| Representative | Party | Years | Congress | District Home | Electoral history |
|---|---|---|---|---|---|
 Barbara Vucanovich Barbara Vucanovich | Republican | January 3, 1983 – January 3, 1997 | 98th | Reno | First elected in 1982 Retired |
99th | |||||
100th | |||||
101st | |||||
102nd | |||||
103rd | |||||
104th | |||||
 Jim Gibbons Jim Gibbons | Republican | January 3, 1997 – December 31, 2006 | 105th | Reno | First elected in 1996 Retired to run for Governor of Nevada, then resigned early to become Governor |
106th | |||||
107th | |||||
108th | |||||
109th | |||||
Vacant | December 31, 2006 – January 3, 2007 | 109th | |||
 Dean Heller Dean Heller | Republican | January 3, 2007 – May 9, 2011 | 110th | Carson City | First elected in 2006 Resigned when appointed to U.S. Senate |
111th | |||||
112th | |||||
Vacant | May 9, 2011 – September 13, 2011 | 112th | |||
 Mark Amodei Mark Amodei | Republican | September 13, 2011 – present | 112th | Carson City | First elected to finish Heller's term |
113th | |||||
114th | |||||
115th | |||||
116th | |||||
Election results
1982 • 1984 • 1986 • 1988 • 1990 • 1992 • 1994 • 1996 • 1998 • 2000 • 2002 • 2004 • 2006 • 2008 • 2010 • 2011 (special) • 2012 • 2014 • 2016 |
1982
| Party | Candidate | Votes | % | ||
|---|---|---|---|---|---|
Republican | Barbara Vucanovich | 70,188 | 55.49 | ||
Democratic | Mary Gojack | 52,265 | 41.32 | ||
Libertarian | Teresa Vuceta | 4,043 | 3.20 | ||
| Total votes | 126,496 | 100.0 | |||
Republican win (new seat) | |||||
1984
| Party | Candidate | Votes | % | |
|---|---|---|---|---|
Republican | Barbara Vucanovich (incumbent) | 99,775 | 71.21 | |
Democratic | Andrew Barbano | 36,130 | 25.79 | |
Libertarian | Dan Becan | 4,201 | 3.00 | |
| Total votes | 140,106 | 100.0 | ||
Republican hold | ||||
1986
| Party | Candidate | Votes | % | |
|---|---|---|---|---|
Republican | Barbara Vucanovich (incumbent) | 83,479 | 58.41 | |
Democratic | Pete Sferrazza | 59,433 | 41.59 | |
| Total votes | 142,912 | 100.0 | ||
Republican hold | ||||
1988
| Party | Candidate | Votes | % | |
|---|---|---|---|---|
Republican | Barbara Vucanovich (incumbent) | 105,981 | 57.26 | |
Democratic | Jim Spoo | 75,163 | 40.61 | |
Libertarian | Kent Cromwell | 3,953 | 2.14 | |
| Total votes | 185,097 | 100.0 | ||
Republican hold | ||||
1990
| Party | Candidate | Votes | % | |
|---|---|---|---|---|
Republican | Barbara Vucanovich (incumbent) | 103,508 | 59.08 | |
Democratic | Jane Wisdom | 59,581 | 34.01 | |
Libertarian | Dan Becan | 12,120 | 6.92 | |
| Total votes | 175,209 | 100.0 | ||
Republican hold | ||||
1992
| Party | Candidate | Votes | % | |
|---|---|---|---|---|
Republican | Barbara Vucanovich (incumbent) | 129,575 | 47.91 | |
Democratic | Pete Sferrazza | 117,199 | 43.33 | |
Independent American | Daniel M. Hansen | 13,285 | 4.91 | |
Libertarian | Dan Becan | 7,552 | 2.79 | |
Populist | Don Golden | 2,850 | 1.05 | |
| Total votes | 270,461 | 100.0 | ||
Republican hold | ||||
1994
| Party | Candidate | Votes | % | |
|---|---|---|---|---|
Republican | Barbara Vucanovich (incumbent) | 142,202 | 63.50 | |
Democratic | Janet Greeson | 65,390 | 29.20 | |
Independent American | Thomas F. Jefferson | 9,615 | 4.29 | |
Natural Law | Lois Avery | 6,725 | 3.00 | |
| Total votes | 223,932 | 100.0 | ||
Republican hold | ||||
1996
| Party | Candidate | Votes | % | |
|---|---|---|---|---|
Republican | Jim Gibbons | 162,310 | 58.56 | |
Democratic | Thomas "Spike" Wilson | 97,942 | 35.26 | |
Independent American | Daniel M. Hansen | 8,780 | 3.17 | |
Natural Law | Lois Avery | 4,628 | 1.67 | |
Libertarian | Louis R. Tomburello | 3,732 | 1.35 | |
| Total votes | 277,192 | 100.0 | ||
Republican hold | ||||
1998
| Party | Candidate | Votes | % | |
|---|---|---|---|---|
Republican | Jim Gibbons (incumbent) | 201,623 | 81.05 | |
Independent American | Christopher Horne | 20,738 | 8.34 | |
Libertarian | Louis R. Tomburello | 18,561 | 7.46 | |
Natural Law | Robert W. Winquist | 7,841 | 3.15 | |
| Total votes | 248,763 | 100.0 | ||
Republican hold | ||||
2000
| Party | Candidate | Votes | % | |
|---|---|---|---|---|
Republican | Jim Gibbons (incumbent) | 229,608 | 64.50 | |
Democratic | Tierney Cahill | 106,379 | 29.88 | |
Independent American | Daniel M. Hansen | 5,582 | 1.57 | |
Green | A. Charles Laws | 5,547 | 1.56 | |
Libertarian | Terry Savage | 5,343 | 1.50 | |
| Citizens First | Ken Brenneman | 2,367 | 0.66 | |
Natural Law | Robert W. Winquist | 1,143 | 0.32 | |
| Total votes | 355,969 | 100.0 | ||
Republican hold | ||||
2002
| Party | Candidate | Votes | % | |
|---|---|---|---|---|
Republican | Jim Gibbons (incumbent) | 149,574 | 74.34 | |
Democratic | Travis O. Souza | 40,189 | 19.97 | |
Independent American | Janine Hansen | 7,240 | 3.60 | |
Libertarian | Brendan Trainor | 3,413 | 1.70 | |
Natural Law | Robert W. Winquist | 784 | 0.39 | |
| Total votes | 201,200 | 100.0 | ||
Republican hold | ||||
2004
| Party | Candidate | Votes | % | |
|---|---|---|---|---|
Republican | Jim Gibbons (incumbent) | 195,466 | 67.15 | |
Democratic | Angie G. Cochran | 79,978 | 27.48 | |
Independent American | Janine Hansen | 10,638 | 3.65 | |
Libertarian | Brendan Trainor | 4,997 | 1.72 | |
| Total votes | 291,079 | 100.0 | ||
Republican hold | ||||
2006
| Party | Candidate | Votes | % | |
|---|---|---|---|---|
Republican | Dean Heller | 117,168 | 50.35 | |
Democratic | Jill Derby | 104,593 | 44.94 | |
Independent | Daniel Rosen | 5,524 | 2.37 | |
Independent American | James C. Kroshus | 5,439 | 2.34 | |
| Total votes | 232,724 | 100.0 | ||
Republican hold | ||||
2008
| Party | Candidate | Votes | % | |
|---|---|---|---|---|
Republican | Dean Heller (incumbent) | 170,771 | 51.82 | |
Democratic | Jill Derby | 136,548 | 41.44 | |
Independent American | John Everhart | 11,179 | 3.39 | |
Libertarian | Sean Patrick Morse | 5,740 | 1.74 | |
Green | Craig Bergland | 5,282 | 1.60 | |
| Total votes | 329,520 | 100.0 | ||
Republican hold | ||||
2010
| Party | Candidate | Votes | % | |
|---|---|---|---|---|
Republican | Dean Heller (incumbent) | 169,458 | 63.30 | |
Democratic | Nancy Price | 87,421 | 32.66 | |
Independent American | Russell Best | 10,829 | 4.05 | |
| Total votes | 267,708 | 100.0 | ||
Republican hold | ||||
2011 (special)
| Party | Candidate | Votes | % | |
|---|---|---|---|---|
Republican | Mark E. Amodei | 74,976 | 58 | |
Democratic | Kate Marshall | 46,669 | 36 | |
Independent | Helmuth Lehmann | 5,354 | 4 | |
Independent American | Timothy Fasano | 2,415 | 2 | |
| Total votes | 129,414 | |||
Republican hold | ||||
2012
| Party | Candidate | Votes | % | |
|---|---|---|---|---|
Republican | Mark Amodei (incumbent) | 162,213 | 57.63 | |
Democratic | Samuel Koepnick | 102,019 | 36.25 | |
Independent American | Russell Best | 6,051 | 2.15 | |
Independent | Michael Haines | 11,166 | 3.97 | |
| Total votes | 281,499 | 100.0 | ||
Republican hold | ||||
2014
| Party | Candidate | Votes | % | |
|---|---|---|---|---|
Republican | Mark Amodei (incumbent) | 122,402 | 65.73 | |
Democratic | Kristen Spees | 52,016 | 27.93 | |
Independent American | Janine Hansen | 11,792 | 6.33 | |
| Total votes | 186,210 | 100.0 | ||
Republican hold | ||||
2016
| Party | Candidate | Votes | % | |
|---|---|---|---|---|
Republican | Mark Amodei (incumbent) | 182,676 | 58.30 | |
Democratic | H.D. "Chip" Evans | 115,722 | 36.93 | |
Independent American | John H. Everhart | 8,693 | 2.77 | |
Independent | Drew Knight | 6,245 | 1.99 | |
| Total votes | 313,336 | 100.0 | ||
Republican hold | ||||
Historical district boundaries

2003 – 2013
See also
- Nevada's congressional districts
- List of United States congressional districts
References
Martis, Kenneth C. (1989). The Historical Atlas of Political Parties in the United States Congress. New York: Macmillan Publishing Company..mw-parser-output cite.citation{font-style:inherit}.mw-parser-output .citation q{quotes:"""""""'""'"}.mw-parser-output .citation .cs1-lock-free a{background:url("//upload.wikimedia.org/wikipedia/commons/thumb/6/65/Lock-green.svg/9px-Lock-green.svg.png")no-repeat;background-position:right .1em center}.mw-parser-output .citation .cs1-lock-limited a,.mw-parser-output .citation .cs1-lock-registration a{background:url("//upload.wikimedia.org/wikipedia/commons/thumb/d/d6/Lock-gray-alt-2.svg/9px-Lock-gray-alt-2.svg.png")no-repeat;background-position:right .1em center}.mw-parser-output .citation .cs1-lock-subscription a{background:url("//upload.wikimedia.org/wikipedia/commons/thumb/a/aa/Lock-red-alt-2.svg/9px-Lock-red-alt-2.svg.png")no-repeat;background-position:right .1em center}.mw-parser-output .cs1-subscription,.mw-parser-output .cs1-registration{color:#555}.mw-parser-output .cs1-subscription span,.mw-parser-output .cs1-registration span{border-bottom:1px dotted;cursor:help}.mw-parser-output .cs1-ws-icon a{background:url("//upload.wikimedia.org/wikipedia/commons/thumb/4/4c/Wikisource-logo.svg/12px-Wikisource-logo.svg.png")no-repeat;background-position:right .1em center}.mw-parser-output code.cs1-code{color:inherit;background:inherit;border:inherit;padding:inherit}.mw-parser-output .cs1-hidden-error{display:none;font-size:100%}.mw-parser-output .cs1-visible-error{font-size:100%}.mw-parser-output .cs1-maint{display:none;color:#33aa33;margin-left:0.3em}.mw-parser-output .cs1-subscription,.mw-parser-output .cs1-registration,.mw-parser-output .cs1-format{font-size:95%}.mw-parser-output .cs1-kern-left,.mw-parser-output .cs1-kern-wl-left{padding-left:0.2em}.mw-parser-output .cs1-kern-right,.mw-parser-output .cs1-kern-wl-right{padding-right:0.2em}
- Congressional Biographical Directory of the United States 1774–present
Notes
^ https://www.census.gov/mycd/?st=32&cd=02
^ "Partisan Voting Index – Districts of the 115th Congress" (PDF). The Cook Political Report. April 7, 2017. Retrieved April 7, 2017.
^ [1] CD 2: 706,464 Average district: 722,711
^ QuickFacts from Census https://www.census.gov
^ "March_2017_Five_Year_Projections" (PDF). Retrieved November 7, 2018.
^ Demirjian, Karoun (April 21, 2011). "Sen. John Ensign to resign, Dean Heller likely replacement". Las Vegas Sun. Retrieved April 29, 2011.
^ Damon, Anjeanette; Demirjian, Karoun (April 28, 2011). "Dean Heller in U.S. Senate shifts landscape in state politics". Las Vegas Sun. Retrieved April 29, 2011.
^ http://www.chron.com/news/article/Republicans-keep-northern-Nevada-House-seat-2169620.php. Retrieved September 14, 2011. Missing or empty|title=(help)
[dead link]
^ Presidential Election Results, by district, swingstateproject.com
^ "1982 Election Results" (PDF). Retrieved November 7, 2018.
^ "1984 Election Results" (PDF). Retrieved November 7, 2018.
^ "1986 Election Results" (PDF). Retrieved November 7, 2018.
^ "1988 Election Results" (PDF). Retrieved November 7, 2018.
^ "1990 Election Results" (PDF). Retrieved November 7, 2018.
^ 1992 Election Results
^ "1994 Election Results" (PDF). Retrieved November 7, 2018.
^ 1996 Election Results
^ "1998 Election Results" (PDF). Retrieved November 7, 2018.
^ "2000 Election Results" (PDF). Retrieved November 7, 2018.
^ "2002 Election Results" (PDF). Retrieved November 7, 2018.
^ "2004 Election Results" (PDF). Retrieved November 7, 2018.
^ "2006 Election Results" (PDF). Retrieved November 7, 2018.
^ "2008 Election Results" (PDF). Retrieved November 7, 2018.
^ "Congressional results". www.nvsos.gov. Retrieved November 7, 2018.
^ U.S. House – District 2 – Special General (2011-09-14). "News from The Associated Press". Hosted.ap.org. Retrieved 2012-08-15.
^ "2012 Official Statewide General Election Coverage and Reports". www.nvsos.gov. Retrieved November 7, 2018.
^ "Silver State Election Night Results – 2014". Nevada Secretary of State. Retrieved 2017-01-17.
^ "Silver State Election Night Results – 2016". Nevada Secretary of State. Retrieved 2017-01-17.
Coordinates: 40°39′04″N 117°19′47″W / 40.65111°N 117.32972°W / 40.65111; -117.32972


