Doljevac
Doljevac Дољевац | ||
|---|---|---|
Town and municipality | ||
| ||
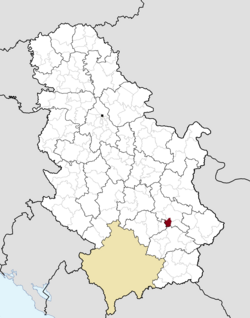 Location of the municipality of Doljevac within Serbia | ||
| Coordinates: 43°12′N 21°50′E / 43.200°N 21.833°E / 43.200; 21.833Coordinates: 43°12′N 21°50′E / 43.200°N 21.833°E / 43.200; 21.833 | ||
| Country | ||
| Region | Southern and Eastern Serbia | |
| District | Nišava | |
| Settlements | 16 | |
| Government | ||
| • Mayor | Goran Ljubić (PSS) | |
| Area [1] | ||
| • Town | 3.17 km2 (1.22 sq mi) | |
| • Municipality | 121 km2 (47 sq mi) | |
| Elevation | 193 m (633 ft) | |
| Population (2011 census)[2] | ||
| • Municipality | 18,463 | |
| • Municipality density | 150/km2 (400/sq mi) | |
| Time zone | UTC+1 (CET) | |
| • Summer (DST) | UTC+2 (CEST) | |
| Postal code | 18410 | |
| Area code | +381(0)18 | |
| Car plates | NI | |
| Website | www.opstinadoljevac.rs | |

Doljevac (Serbian Cyrillic: Дољевац) is a town and municipality located in the Nišava District of the southern Serbia. According to 2011 census, the municipality has 18,463 inhabitants.
Contents
1 Geography
2 Demographics
2.1 Ethnic groups
3 Economy
4 See also
5 References
6 External links
Geography
The municipality borders Merošina municipality and City of Niš in the north, Gadžin Han municipality in the east, Leskovac municipality in the south, and Žitorađa municipality in the west.
Demographics
| Historical population | ||
|---|---|---|
| Year | Pop. | ±% p.a. |
| 1948 | 17,641 | — |
| 1953 | 18,825 | +1.31% |
| 1961 | 19,860 | +0.67% |
| 1971 | 20,228 | +0.18% |
| 1981 | 20,663 | +0.21% |
| 1991 | 20,662 | −0.00% |
| 2002 | 19,561 | −0.50% |
| 2011 | 18,463 | −0.64% |
| Source: [3] | ||
According to the last official census done in 2011, the municipality of Doljevac has 18,463 inhabitants.
Ethnic groups
The ethnic composition of the municipality:[4]
| Ethnic group | Population |
|---|---|
| Serbs | 17,008 |
| Roma | 1,218 |
| Macedonians | 17 |
| Montenegrins | 8 |
| Croats | 8 |
| Yugoslavs | 5 |
| Russians | 5 |
| Romanians | 4 |
| Others | 190 |
| Total | 18,463 |
Economy
The following table gives a preview of total number of employed people per their core activity (as of 2016):[5]
| Activity | Total |
|---|---|
| Agriculture, forestry and fishing | 3 |
| Mining | 23 |
| Processing industry | 3,142 |
| Distribution of power, gas and water | 7 |
| Distribution of water and water waste management | 3 |
| Construction | 64 |
| Wholesale and retail, repair | 395 |
| Traffic, storage and communication | 128 |
| Hotels and restaurants | 51 |
| Media and telecommunications | 5 |
| Finance and insurance | 4 |
| Property stock and charter | - |
| Professional, scientific, innovative and technical activities | 67 |
| Administrative and other services | 96 |
| Administration and social assurance | 120 |
| Education | 203 |
| Healthcare and social work | 160 |
| Art, leisure and recreation | 18 |
| Other services | 38 |
| Total | 4,526 |
See also
- Nišava District
- Subdivisions of Serbia
References
^ "Municipalities of Serbia, 2006". Statistical Office of Serbia. Retrieved 2010-11-28..mw-parser-output cite.citation{font-style:inherit}.mw-parser-output .citation q{quotes:"""""""'""'"}.mw-parser-output .citation .cs1-lock-free a{background:url("//upload.wikimedia.org/wikipedia/commons/thumb/6/65/Lock-green.svg/9px-Lock-green.svg.png")no-repeat;background-position:right .1em center}.mw-parser-output .citation .cs1-lock-limited a,.mw-parser-output .citation .cs1-lock-registration a{background:url("//upload.wikimedia.org/wikipedia/commons/thumb/d/d6/Lock-gray-alt-2.svg/9px-Lock-gray-alt-2.svg.png")no-repeat;background-position:right .1em center}.mw-parser-output .citation .cs1-lock-subscription a{background:url("//upload.wikimedia.org/wikipedia/commons/thumb/a/aa/Lock-red-alt-2.svg/9px-Lock-red-alt-2.svg.png")no-repeat;background-position:right .1em center}.mw-parser-output .cs1-subscription,.mw-parser-output .cs1-registration{color:#555}.mw-parser-output .cs1-subscription span,.mw-parser-output .cs1-registration span{border-bottom:1px dotted;cursor:help}.mw-parser-output .cs1-ws-icon a{background:url("//upload.wikimedia.org/wikipedia/commons/thumb/4/4c/Wikisource-logo.svg/12px-Wikisource-logo.svg.png")no-repeat;background-position:right .1em center}.mw-parser-output code.cs1-code{color:inherit;background:inherit;border:inherit;padding:inherit}.mw-parser-output .cs1-hidden-error{display:none;font-size:100%}.mw-parser-output .cs1-visible-error{font-size:100%}.mw-parser-output .cs1-maint{display:none;color:#33aa33;margin-left:0.3em}.mw-parser-output .cs1-subscription,.mw-parser-output .cs1-registration,.mw-parser-output .cs1-format{font-size:95%}.mw-parser-output .cs1-kern-left,.mw-parser-output .cs1-kern-wl-left{padding-left:0.2em}.mw-parser-output .cs1-kern-right,.mw-parser-output .cs1-kern-wl-right{padding-right:0.2em}
^ "2011 Census of Population, Households and Dwellings in the Republic of Serbia: Comparative Overview of the Number of Population in 1948, 1953, 1961, 1971, 1981, 1991, 2002 and 2011, Data by settlements" (PDF). Statistical Office of Republic Of Serbia, Belgrade. 2014. ISBN 978-86-6161-109-4. Retrieved 2014-06-27.
^ "2011 Census of Population, Households and Dwellings in the Republic of Serbia" (PDF). stat.gov.rs. Statistical Office of the Republic of Serbia. Retrieved 16 February 2018.
^ "ETHNICITY Data by municipalities and cities" (PDF). stat.gov.rs. Statistical Office of Serbia. Retrieved 16 February 2018.
^ "ОПШТИНЕ И РЕГИОНИ У РЕПУБЛИЦИ СРБИЈИ, 2017" (PDF). stat.gov.rs (in Serbian). Statistical Office of the Republic of Serbia. Retrieved 20 February 2017.
External links
| Wikimedia Commons has media related to Doljevac. |
- Official website
Municipalities and cities of Southern and Eastern Serbia | ||
|---|---|---|
| Cities |
|  |
| Municipalities |
| |
Authority control |
|
|---|
This Nišava District, Serbia location article is a stub. You can help Wikipedia by expanding it. |


